 BlinQJoin The Waitlist
 See the pattern behind your eye strain.
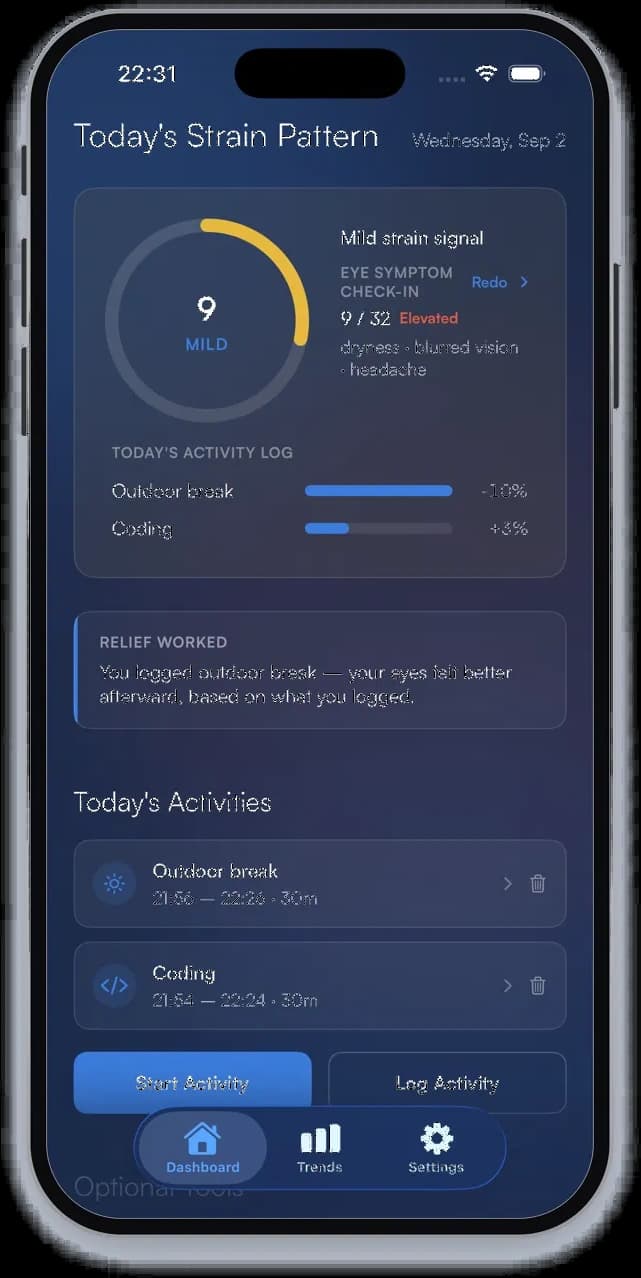
BlinQ tracks what you do and how your eyes feel, so you can spot the pattern — not just the symptom.
Unmanaged screen-time symptoms cost an estimated $151bn in the US in 2023, including $50.6bn in lost productivity.
The current best fix, blue-light glasses, cuts symptoms by only about 8%.
No accurate, continuous way exists to monitor eye strain outside a clinic.
A Growing Problem
Screen use has become a necessity, whether it be at school, in the office, or on the couch at home, yet eye strain continues to affect comfort, productivity and long-term eyesight — with no easy way to track or manage it.
Measuring Eye Strain
BlinQ uses camera-based eye tracking to measure signals such as blink rate, incomplete blinks, and eye openness, alongside a visual processing (flicker fusion) test that tracks how quickly your eyes detect flicker. Combined with logged activities and calculated symptom scores, this provides users with an ongoing, trackable measure of strain.
Advanced Monitoring Ecosystem
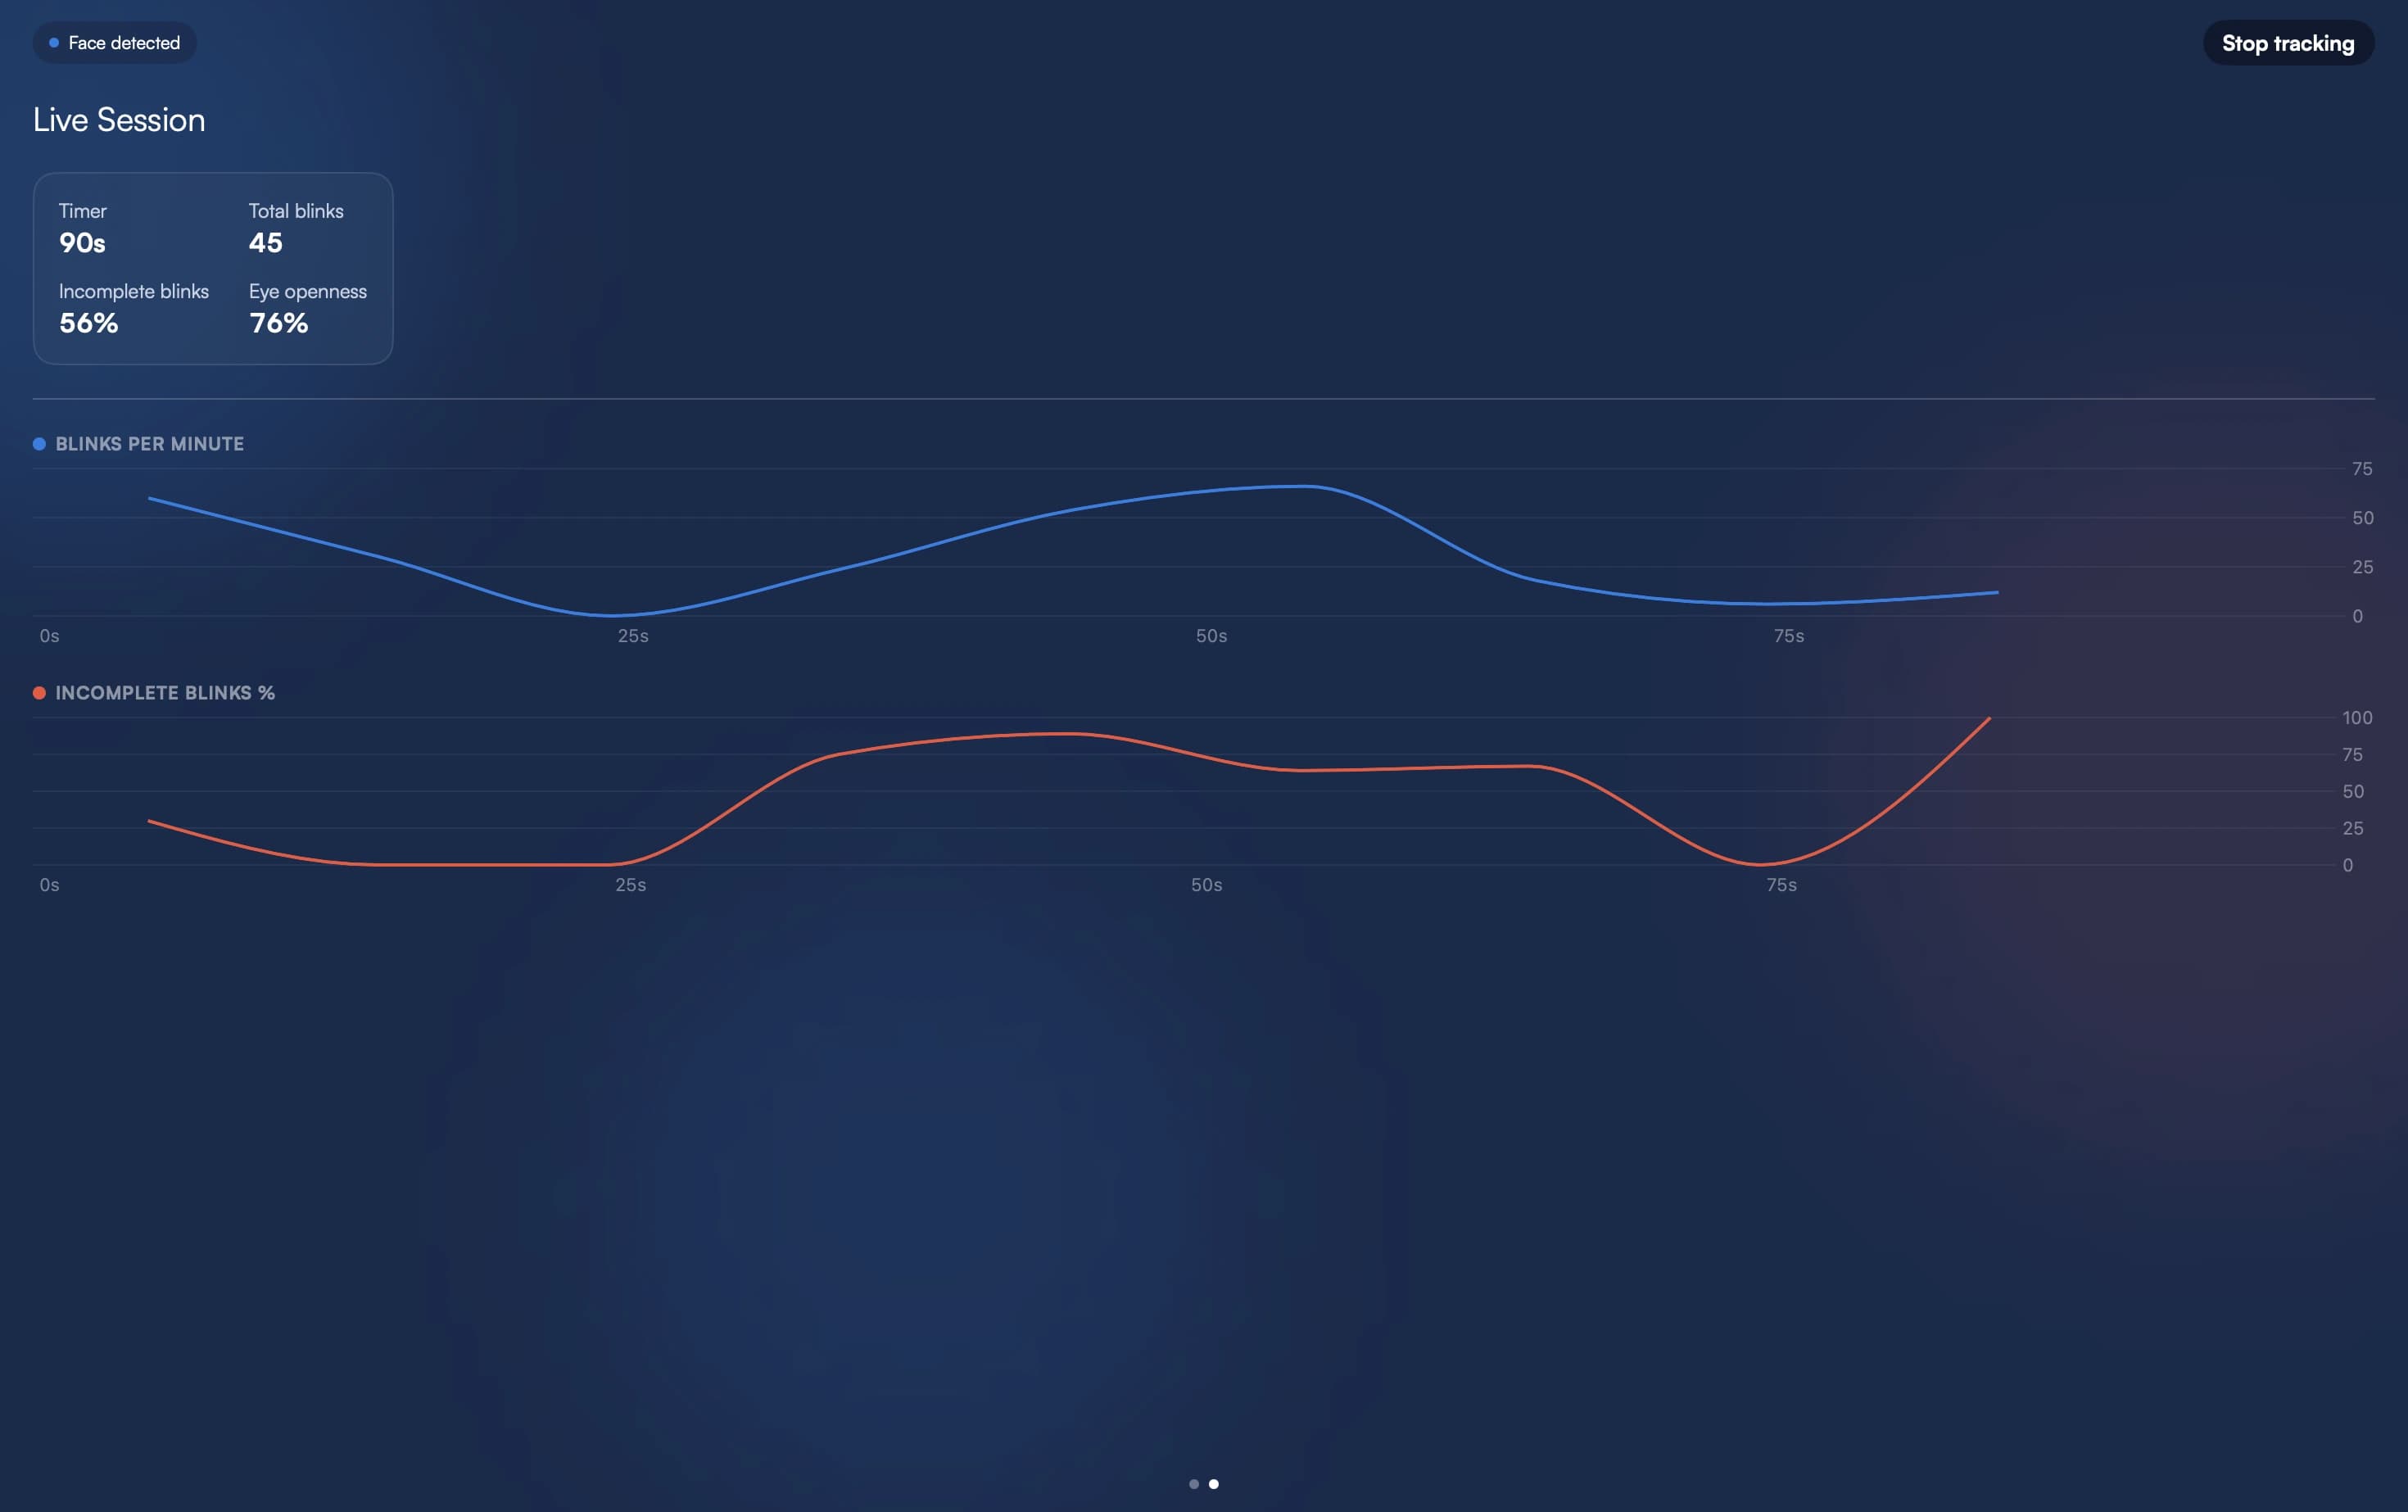
Key Digital Eye Strain Biomarkers
We monitor these distinct factors to calculate your aggregate Eye Fatigue Score.
Ideal average is 15–20. Your rate drops significantly during focused work.
Keep monitors at least 20 inches away to reduce muscular focusing strain.
Continuous focus without a recovery break.
High fatigue. BlinQ recommends taking a screen break soon.
Identify the Trends
BlinQ compiles daily metrics into historical trends, helping you visualize progress. Eye strain rarely comes from one thing. BlinQ helps you connect the dots between your day and how your eyes feel, so you can adjust before discomfort builds — using your own data, compared to your own baseline.
- Daily, Weekly, and Monthly Reports
- Sleep cycle correlations & screen time sync
Trends
Last 7 days — hover a bar to see what that day looked like. Grey means no Eye Symptom Check-in.
Give your eyes the break they deserve
Connect the dots between your day and how your eyes feel, so you can adjust before discomfort builds — using your own data, compared to your own baseline.
Join The Waitlist